
The Limitations of Dashboards
Dashboards have been the industry's default for schedule reporting for decades. But here's the reality:
You're forced to interpret results yourself, jumping from chart to chart to piece together insights.
Dashboards never answer the exact question in your mind-at best, they get you in the ballpark.
Different roles always want different views-meaning more dashboards, more cost, more chaos.
Each user persona sees the same dashboard through a completely different lens:
- A scheduler reviewing float might ask: "Which activities have lost float since last update?"
- A project manager might wonder: "Which delayed tasks will push our milestone?"
- An executive wants: "How is overall project completion trending this quarter?"
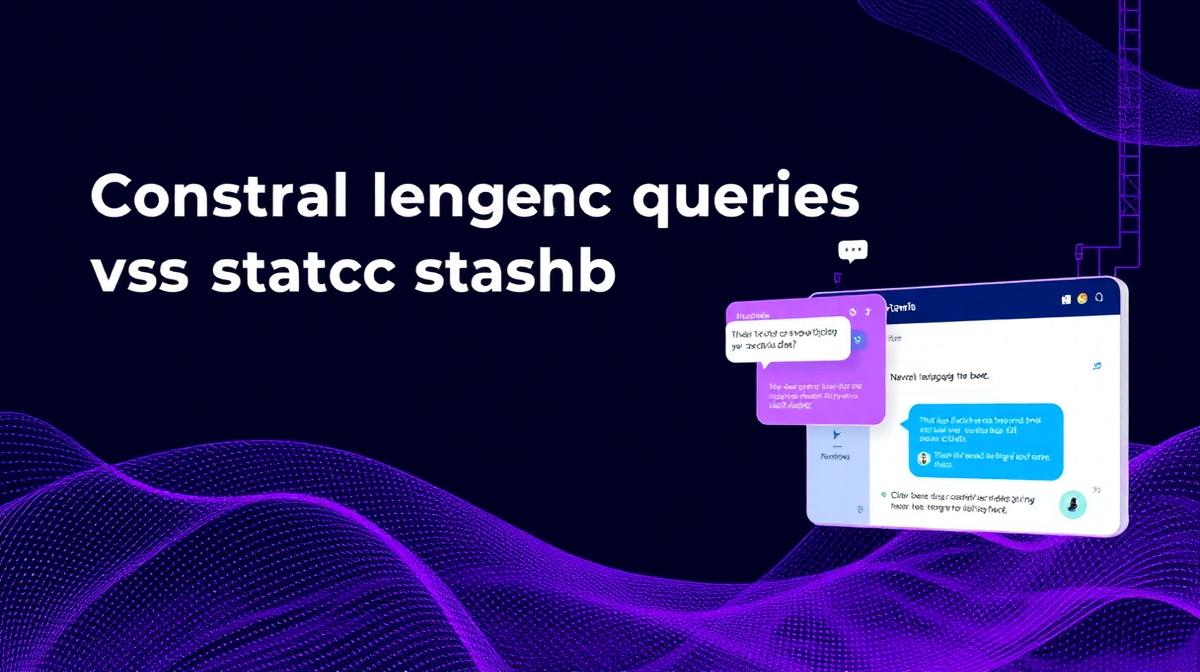
IQ‑Insights: Natural Language Q&A is the Answer
IQ‑Insights changes everything by letting you ask questions directly, in plain language, and get instant answers-no dashboards, no clicks, no filters.
Listing Activities & Dependencies
Finding Changes Across Versions
Performing Aggregations
Visualizing S-Curves & Histograms
Distributions & Trends
Why This Matters
No more dashboards to build, share, or maintain
No more manual drill-downs
Just the answers you need, when you need them-every time
Natural language Q&A turns schedule analysis from a static, time-consuming exercise into a dynamic, interactive conversation-so every team member can get exactly what they need, instantly.
Ready to see IQ‑Insights in action?
Join hundreds of AEC teams already saving hours every week.